Blog
How Does CRM Software Work? Step-by-Step Explained
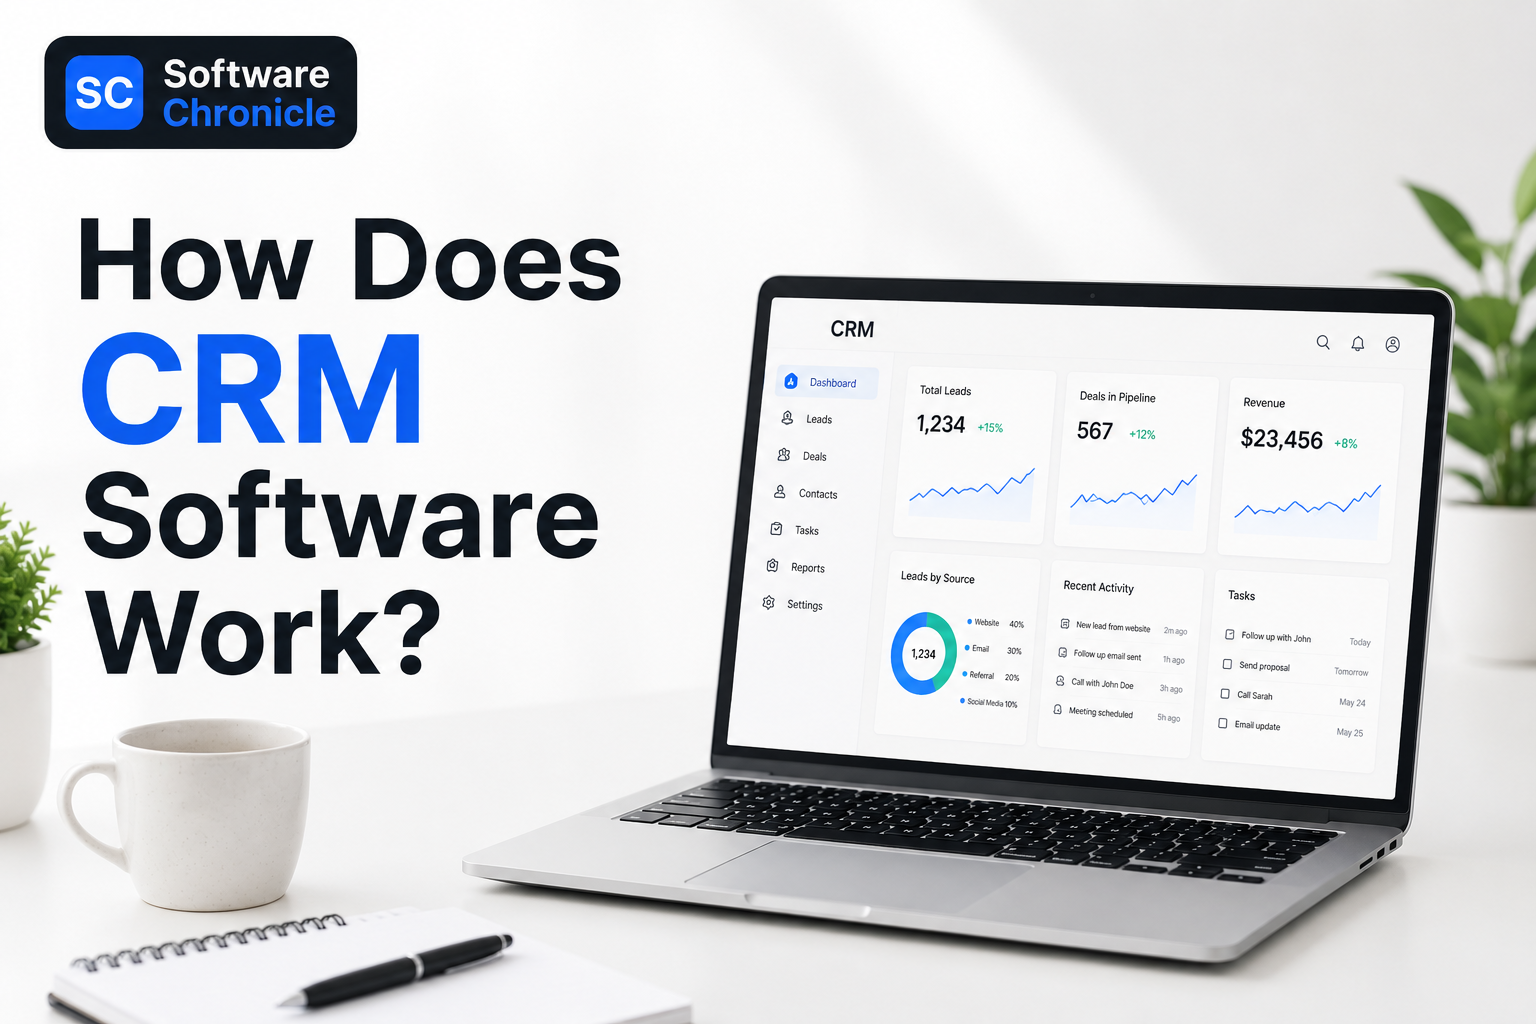
If you have ever wondered how businesses keep track of hundreds or even thousands of customers without everything turning into complete chaos, the answer is usually CRM software.
A CRM, short for Customer Relationship Management software, helps businesses organize customer information, track conversations, manage sales pipelines, and automate follow-ups in one central place. Instead of relying on spreadsheets, scattered notes, inbox searches, or memory, teams use CRM systems to keep every interaction connected and easy to access.
Think about how many ways customers interact with businesses today. Someone might discover a company through Google, sign up for a newsletter, book a demo, reply to emails, speak with sales, contact support later, and eventually make multiple purchases over time. Without a proper system, keeping track of all of that becomes messy very quickly.
That is where CRM software becomes valuable.
Modern CRM platforms automatically log emails, store contact details, track customer activity, schedule reminders, manage deals, and generate reports that help businesses understand what is happening inside their sales process. Many systems also connect with marketing platforms, ecommerce stores, calendars, support tools, and communication apps through third-party integrations.
In this guide, we will break down exactly how CRM software works, how CRM workflows operate behind the scenes, and how businesses actually use CRM systems day to day to manage leads, customers, and sales more efficiently.
Quick Takeaways
- CRM software works by storing customer information, tracking interactions, organizing sales pipelines, and automating follow-ups inside one centralized platform.
- Modern CRM systems automatically collect data from emails, website forms, calls, calendars, marketing tools, ecommerce stores, and customer support platforms through integrations and contact sync.
- Businesses use CRM software to manage leads, monitor deals, schedule reminders, log emails, track customer activity, and improve communication across teams.
- The typical CRM workflow includes lead capture, contact management, sales tracking, automation, reporting, and long-term customer relationship management.
- CRM dashboards help businesses track sales performance, conversion rates, customer activity, pipeline health, and team productivity in real time.
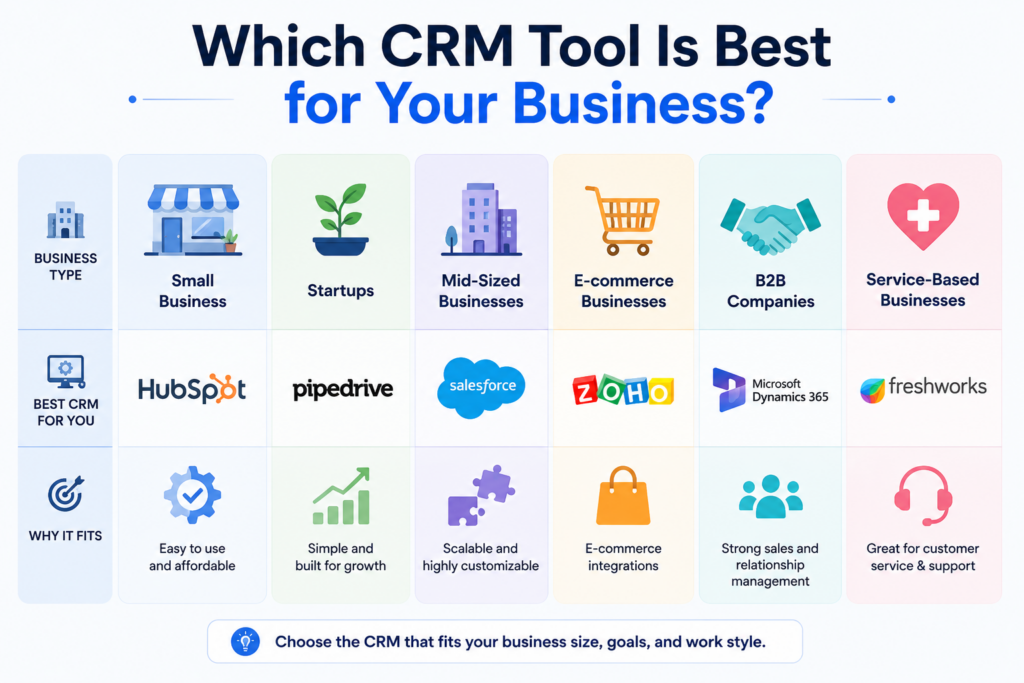
- Popular CRM tools include Salesforce, HubSpot CRM, Zoho CRM, Microsoft Dynamics 365, and Pipedrive.
- CRM automation reduces repetitive tasks like data entry, follow-up reminders, lead assignment, and email logging, helping teams save time and improve consistency.
- According to Freshworks, businesses using CRM software are significantly more likely to exceed their sales goals and improve customer retention.
- The four main types of CRM are operational CRM, analytical CRM, collaborative CRM, and strategic CRM.
- CRM software is no longer just for large enterprises. Small businesses, startups, agencies, ecommerce brands, and service companies now rely heavily on CRM platforms to stay organized and scale customer relationships.
What Is CRM Software?
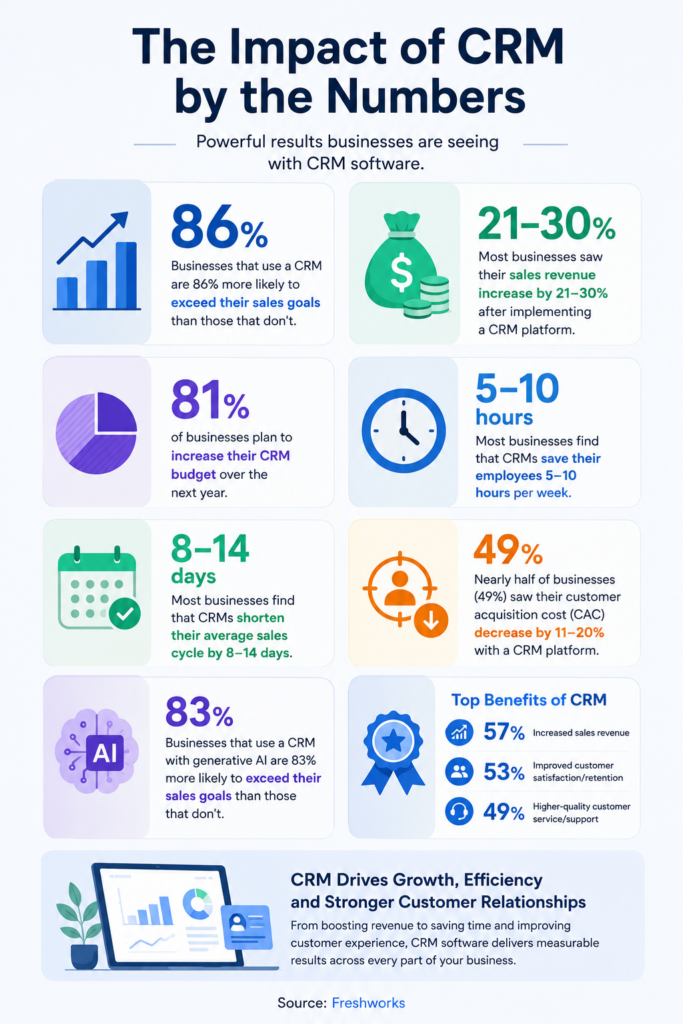
Source: Freshworks
CRM software, short for Customer Relationship Management software, is a system businesses use to manage customer interactions, sales processes, follow-ups, and communication in one centralized platform.
Instead of storing customer information across spreadsheets, inboxes, sticky notes, and disconnected tools, a CRM brings everything together into a single database that teams can access in real time.
A modern CRM system typically stores:
- customer contact information
- email conversations
- meeting history
- sales activity
- deal pipelines
- tasks and reminders
- support interactions
- purchase history
- marketing engagement
The goal of CRM software is simple: help businesses build stronger customer relationships while improving organization and efficiency internally.
For example, if a potential customer fills out a contact form on a website, the CRM can automatically create a lead profile, assign the lead to a sales rep, log future emails, schedule follow-ups, and track where that lead sits inside the sales pipeline. As the relationship grows, the CRM continues updating the customer record automatically.
That is why CRM systems are now used by:
- sales teams
- marketing departments
- ecommerce businesses
- agencies
- SaaS companies
- consultants
- support teams
- enterprise organizations
According to Salesforce, CRM software helps businesses improve customer retention, sales visibility, forecasting, and operational collaboration by centralizing customer information across departments.
Modern CRM platforms also include automation features that reduce repetitive work such as reminder scheduling, email logging, lead assignment, and activity tracking. Many systems now integrate with email platforms, calendars, accounting software, ecommerce systems, and marketing tools to create connected workflows across the business.
In simple terms, CRM software acts as the operational hub for customer management. It helps businesses understand who their customers are, where conversations stand, what actions need to happen next, and how relationships evolve over time.
Step 1: Customer Data Enters the CRM
Every CRM system starts with customer information entering the platform. This usually happens automatically through integrations connected to websites, email platforms, ecommerce stores, calendars, live chat tools, social media lead forms, and marketing software.
For example, if someone fills out a contact form on a website, the CRM can instantly create a lead profile with their name, email address, company details, and source of inquiry. If a customer books a call or replies to a marketing email, the CRM logs that interaction automatically as well.
Modern CRM software is designed to centralize customer data from multiple channels instead of forcing teams to update spreadsheets manually. This is one of the biggest reasons businesses adopt CRM systems as they grow.
Without a CRM, customer information often becomes scattered across inboxes, documents, notes, and disconnected apps, making it difficult to maintain organized communication.
Step 2: The CRM Creates a Central Customer Profile
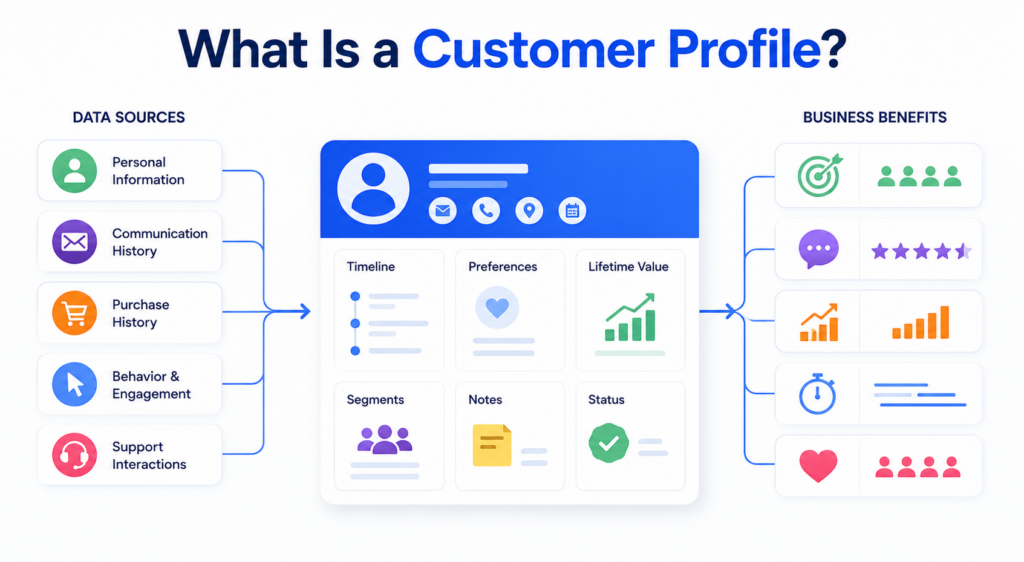
Once information enters the system, the CRM creates a complete customer profile that stores every interaction connected to that lead or customer.
This profile acts like a living timeline.
Instead of employees searching through emails or asking coworkers for updates, they can immediately see the customer’s communication history, meeting notes, tasks, purchases, support conversations, and sales activity in one place.
As new interactions happen, the CRM updates the profile automatically. If a lead opens emails frequently, revisits pricing pages, schedules meetings, or contacts support, those actions are logged inside the customer record.
This centralized structure is what makes CRM software significantly more useful than traditional spreadsheets or disconnected databases.
Step 3: Contacts Get Organized and Segmented
As customer databases grow, organization becomes extremely important.
CRM systems help businesses categorize contacts into different groups based on factors such as lifecycle stage, lead quality, industry, customer type, or sales status.
For example, businesses may separate contacts into:
- new leads
- qualified prospects
- active customers
- enterprise accounts
- repeat buyers
- inactive clients.
This segmentation helps businesses personalize communication and manage workflows more effectively.
A marketing team may want different email campaigns for different customer groups, while sales teams may prioritize high-value leads inside separate pipelines.
Modern CRM software makes this process dynamic and searchable, allowing businesses to filter contacts instantly rather than manually sorting spreadsheets.
Step 4: Leads Move Through the Sales Pipeline
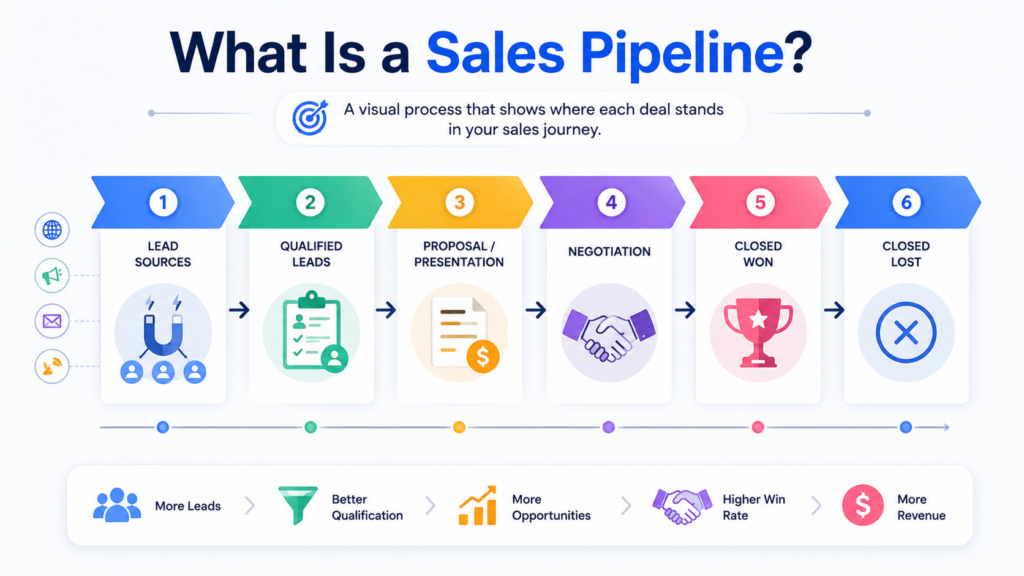
One of the most recognizable parts of CRM software is pipeline management.
The CRM pipeline visually tracks where leads currently stand inside the sales process. As conversations progress, sales teams move opportunities through different stages that represent the customer journey.
A typical CRM process may include stages such as lead captured, qualified, discovery call completed, proposal sent, negotiation, and closed deal.
This gives businesses much clearer visibility into sales activity, deal progression, conversion rates, forecasting, and projected revenue.
Instead of guessing where opportunities stand, teams can monitor pipeline movement in real time.
Pipeline tracking also helps businesses identify bottlenecks. If deals repeatedly stall during certain stages, managers can investigate whether pricing, communication, or follow-up processes need improvement.
Step 5: CRM Software Tracks Customer Activity Automatically
Modern CRM platforms continuously track customer interactions behind the scenes.
This includes emails, calls, meetings, website visits, proposal views, purchases, appointment bookings, and support conversations.
For example, if a lead repeatedly opens a proposal or visits pricing pages multiple times, the CRM may notify the sales team automatically because that activity often signals buying intent.
Activity tracking helps businesses understand how engaged customers are throughout the sales process.
Many CRM systems also include detailed timelines showing every interaction chronologically. This allows employees to quickly understand relationship history before speaking with a customer.
Instead of relying on memory or disconnected notes, teams work from a complete customer record.
Step 6: Automation Handles Repetitive Tasks
One of the biggest advantages of CRM software is automation.
Without automation, employees spend significant amounts of time manually updating records, scheduling reminders, assigning leads, and tracking follow-ups.
CRM systems automate many of these repetitive tasks automatically.
For example, the CRM may assign new leads to sales reps, trigger follow-up emails after meetings, create reminders for inactive deals, update pipeline stages, or notify managers about overdue tasks.
This reduces administrative work while helping businesses maintain more consistent communication.
Automation becomes especially valuable as companies grow because managing customer relationships manually becomes increasingly difficult with higher lead volume and larger sales teams.
Step 7: Teams Use CRM Dashboards to Monitor Performance
Most CRM systems include dashboards and reporting tools that give businesses real-time visibility into sales activity and customer management.
CRM dashboards typically display information such as:
active deals, sales performance, conversion rates, pipeline value, customer activity, lead sources, and forecasting.
Managers can quickly see which sales reps are performing best, which channels generate quality leads, and where deals are slowing down.
This reporting visibility helps businesses make faster decisions because teams no longer need to manually build reports in spreadsheets every week.
Modern CRM dashboards update automatically as customer activity changes inside the system.
Step 8: CRM Integrations Connect Business Tools Together
Modern businesses rarely operate using only one software platform.
Sales teams use email tools, marketing teams use automation platforms, ecommerce stores use payment systems, and support departments use ticketing software. CRM systems help connect all of these tools together.
Most modern CRM platforms integrate with services such as Gmail, Outlook, Shopify, Slack, Zoom, QuickBooks, Stripe, Google Calendar, and marketing automation platforms.
These integrations allow information to sync automatically between systems.
For example, invoices may appear inside customer profiles, support tickets may attach to account records, and calendar meetings may log automatically inside the CRM timeline.
This creates a much more connected operational workflow across departments.
Step 9: The CRM Continues Working After the Sale
A lot of people assume CRM software is only for generating leads and closing sales.
In reality, CRM systems continue helping businesses long after customers convert.
Many businesses use CRM platforms for onboarding, customer support, renewals, upsells, retention campaigns, and long-term account management.
For example, a SaaS company may use CRM workflows to monitor customer health and renewal timelines, while agencies may use CRM systems to manage onboarding processes and client communication.
This long-term relationship management is one of the biggest reasons CRM software improves customer retention over time.
CRM systems are designed to support the entire customer lifecycle, not just the initial sale.
The 4 Main Types of CRM
Businesses often hear about different CRM models and categories.
The four main types are:
Operational CRM
Operational CRM focuses on sales, marketing, and service automation. This is the most common CRM category for businesses.
Analytical CRM
Analytical CRM focuses heavily on reporting, customer insights, forecasting, and data analysis.
Collaborative CRM
Collaborative CRM improves communication between departments and customer-facing teams.
Strategic CRM
Strategic CRM focuses on long-term customer relationship management and customer retention strategies.
Many modern CRM platforms combine features from multiple CRM categories simultaneously.
What Are the 5 Steps of the CRM Process?
According to Zendesk, the CRM process typically includes five major stages:
- Reaching potential customers
- Acquiring leads
- Converting prospects into customers
- Retaining customers
- Building long-term loyalty
CRM software supports all five stages by centralizing customer data and automating workflows throughout the customer journey.
Is Excel a CRM?
Technically, businesses can track customer information inside spreadsheets.
However, Excel is not a true CRM system.
Spreadsheets lack:
- automation workflows
- activity tracking
- email logging
- pipeline management
- collaboration tools
- integrations
- customer timelines
As businesses grow, spreadsheets become difficult to manage and scale effectively.
That is why most growing businesses eventually move to dedicated CRM software.
What Are the Top CRM Tools?
Some of the most widely used CRM platforms include:
Different CRM tools focus on different business sizes and workflows.
For example:
- Salesforce is popular for enterprise businesses
- HubSpot is widely used by SMBs and marketing teams
- Pipedrive focuses heavily on sales pipeline simplicity
- Zoho CRM is known for affordability and customization
Read Also: CRM Software for Small Business: What to Look For
Why CRM Software Matters for Modern Businesses
CRM software has become essential because customer management is now significantly more complex than it was years ago.
Businesses communicate across:
- websites
- social media
- chat
- calls
- ecommerce systems
- marketing platforms
- support systems
Without a centralized CRM, customer information becomes fragmented quickly.
CRM software helps businesses:
- improve organization
- automate workflows
- increase visibility
- improve follow-up consistency
- strengthen customer relationships
- improve reporting
- scale sales operations
According to Freshworks, 93% of businesses reported higher customer retention rates after implementing CRM software.
For many businesses, CRM software becomes the operational center of sales and customer management.
Frequently Asked Questions
What are the 4 types of CRM?
The four major CRM types are operational CRM, analytical CRM, collaborative CRM, and strategic CRM. Each category focuses on different aspects of customer management, automation, reporting, and collaboration.
What is a CRM and how to use it?
A CRM is software used to manage customer relationships, sales pipelines, communication history, and business workflows. Businesses use CRM systems to track leads, organize customer data, automate follow-ups, monitor deals, and improve customer interactions.
Does NetSuite have a CRM?
Yes. NetSuite includes CRM functionality as part of its broader ERP and business management platform. NetSuite CRM supports sales automation, customer management, forecasting, marketing workflows, and reporting.
What are the 5 steps of the CRM process?
The CRM process typically includes lead generation, customer acquisition, conversion, retention, and customer loyalty management. CRM software helps automate and organize each stage.
Is Excel a CRM?
No. While businesses can store customer data in spreadsheets, Excel does not provide the automation, reporting, workflow management, and customer tracking capabilities of a true CRM platform.
What are the top 3 CRM tools?
Salesforce, HubSpot CRM, and Microsoft Dynamics 365 are often considered among the top CRM platforms because of their scalability, integrations, and feature depth.
What are the golden rules of CRM?
Strong CRM practices usually focus on maintaining accurate customer data, consistent follow-ups, clear communication, automation efficiency, and long-term relationship building.
What are the 5 CRM skills?
Important CRM skills include communication, organization, data analysis, customer relationship management, and workflow management.
How do CRM integrations work?
CRM systems connect with third-party tools such as email platforms, ecommerce systems, marketing automation tools, calendars, accounting software, and support platforms through integrations and APIs. These integrations help businesses centralize workflows and reduce manual data entry.
Can small businesses use CRM software?
Yes. Many CRM platforms are designed specifically for small businesses and startups. Cloud-based CRM systems allow smaller teams to organize customer relationships and automate workflows without needing enterprise infrastructure.
Software Chronicle’s Guide to Smarter CRM & Sales Tools
At Software Chronicle, we publish practical CRM guides, SaaS reviews, sales software comparisons, and workflow optimization resources designed to help businesses choose smarter technology systems.
To learn more about how we evaluate software platforms, visit our How We Review Software page. You can also review our Affiliate Disclosure for transparency regarding affiliate partnerships and recommendations.
Contact us if you need help understanding which CRM platform best fits your business workflows and growth goals.
Najm Us Sahar Fareed is part of the editorial team at Software Chronicle, a group of SaaS researchers and former software buyers who have collectively evaluated over 200 tools across the categories we cover. With 5 years of experience working with digital marketing agencies across North America, she brings a strong background in content strategy and practical software evaluation.
Blog
12 Best Data Visualization Software Platforms in 2026
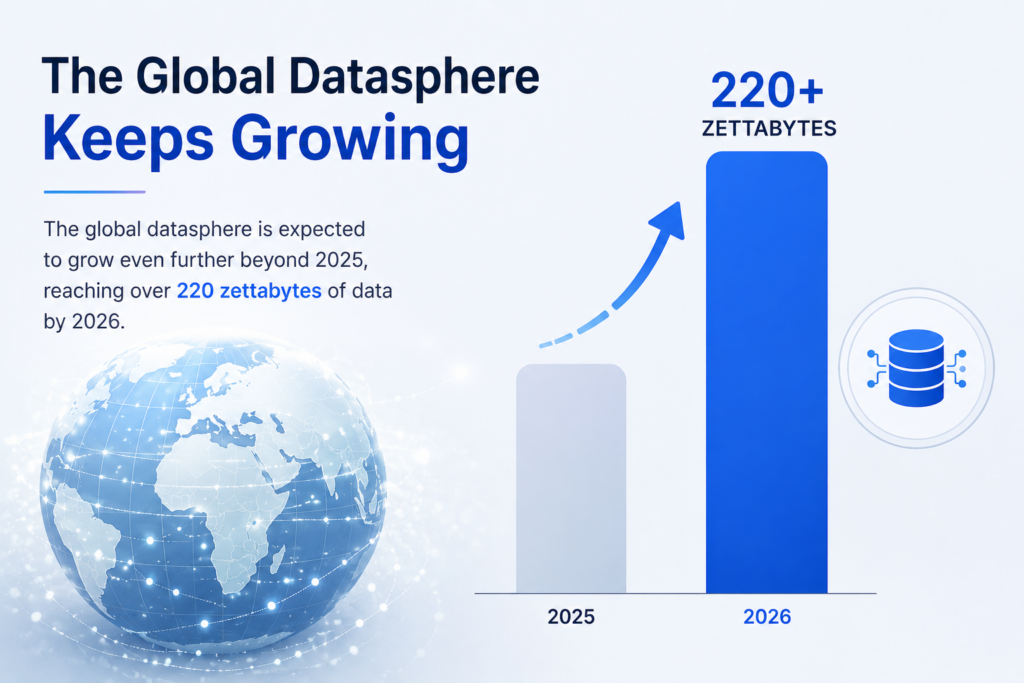
Businesses generate more data today than ever before. Marketing platforms track customer behavior in real time, ecommerce stores collect sales and inventory insights continuously, SaaS companies monitor product usage daily, and operational teams rely on dashboards to manage workflows across departments. The challenge is no longer collecting information. The real challenge is making that information understandable and useful.
Large spreadsheets and static reports rarely help teams move faster. Raw numbers can quickly become overwhelming, especially when businesses are working across multiple systems and trying to identify patterns, trends, or performance issues quickly. Decision-makers need data presented in a way that is visual, interactive, and easy to interpret.
That is why the demand for the best data visualization software continues to grow across nearly every industry.
Modern visualization platforms help businesses transform complex datasets into dashboards, charts, maps, reports, and interactive analytics environments that simplify reporting and improve decision-making. Instead of manually compiling spreadsheets or waiting for static reports, teams can monitor performance in real time and explore data dynamically through visual interfaces.
The best data visualization platforms now go far beyond basic graphs. Many support advanced dashboard creation, drill-down analytics, interactive filtering, real-time data syncing, embedded reporting, geospatial visualization, and collaborative sharing across organizations. Businesses can visualize marketing campaigns, financial reporting, operational KPIs, customer behavior, inventory systems, and infrastructure performance from centralized dashboards.
Different platforms focus on different needs. Some tools prioritize enterprise-scale business intelligence and advanced analytics, while others focus more heavily on usability, storytelling, or lightweight reporting workflows for smaller teams.
In this guide, we will break down the best data visualization software platforms in 2026, including business intelligence tools, interactive dashboard platforms, chart building software, and reporting solutions for modern organizations. Whether you are analyzing marketing performance, building executive dashboards, monitoring operations, or presenting complex analytics visually, this guide will help you choose the right platform for your business.
Quick Takeaways
- Tableau, Power BI, Looker, and Databricks AI/BI are among the leading data visualization software platforms for enterprise reporting, dashboarding, governance, and scalable analytics ecosystems.
- Power BI is widely preferred by businesses already using Microsoft products because of its affordability, enterprise integrations, and strong dashboard capabilities.
- Tableau remains one of the strongest interactive dashboard tools for advanced analytics, highly customized visualizations, and deep drill-down reporting.
- Looker Studio is one of the most popular free options for marketing dashboards, especially for businesses using Google Analytics, Google Ads, and Search Console.
- Modern data visualization platforms now support real-time dashboards, AI-assisted analytics, interactive filtering, embedded reporting, and collaborative data exploration.
- Businesses increasingly use visualization software to simplify complex datasets into charts, KPI dashboards, geo maps, treemaps, and operational reports that are easier to understand and act on.
- ChatGPT can assist with data analysis and data visualization workflows by helping users interpret datasets, generate charts, summarize analytics, and automate reporting tasks.
- SQL and Tableau serve different purposes. SQL provides deeper control over raw data manipulation, while Tableau focuses on visual analytics and dashboard creation for reporting and business intelligence.
- Open-source platforms such as Grafana, Apache Superset, and Metabase are becoming increasingly popular among technical teams wanting flexible analytics environments with lower licensing costs.
- Real-time reporting has become a major priority because businesses increasingly rely on live operational data instead of manually updated spreadsheets and static reports.
Quick Comparison Table
| Platform | Best For | Free Plan | Starting Price | Standout Feature |
| Tableau | Advanced business intelligence | Limited | Premium | Deep interactive analytics |
| Power BI | Microsoft ecosystem | Yes | Affordable | Enterprise integrations |
| Looker Studio | Google reporting | Yes | Free | Marketing dashboard simplicity |
| Qlik Sense | Associative analytics | Limited | Premium | Dynamic data exploration |
| Domo | Executive dashboards | No | Enterprise pricing | Real-time business visibility |
| Sisense | Embedded analytics | No | Enterprise pricing | Scalable embedded BI |
| Zoho Analytics | SMB reporting | Yes | Affordable | Easy business dashboards |
| Grafana | Operational analytics | Yes | Open-source | Real-time infrastructure data |
| Apache Superset | Open-source BI | Yes | Free | Flexible dashboard building |
| Metabase | Lightweight analytics | Yes | Affordable | Simple team analytics |
| Infogram | Presentation visuals | Yes | Affordable | Visual storytelling |
| Flourish | Interactive visual content | Yes | Flexible pricing | Advanced visual storytelling |
Why Data Visualization Matters More Than Ever
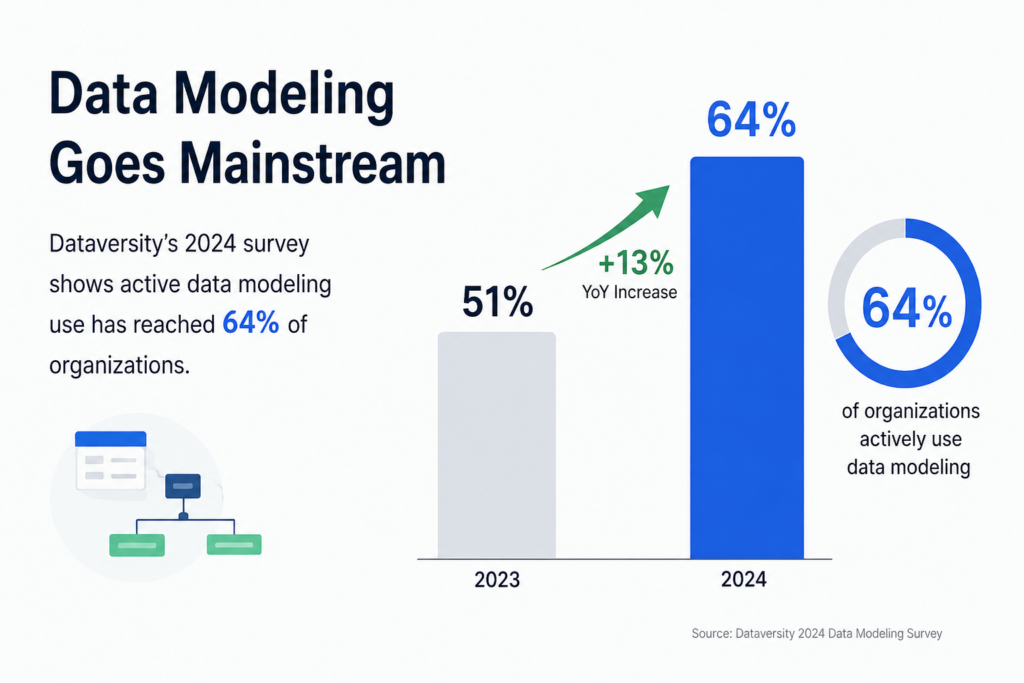
Source: Dataversity: The trend in data modeling in 2025.
Businesses make decisions faster today than ever before.
Marketing teams monitor campaign performance daily. Ecommerce operators track inventory and revenue in real time. SaaS companies analyze churn, retention, feature usage, and customer engagement continuously. Financial teams monitor forecasting, profitability, and operational costs across multiple systems simultaneously.
The problem is that raw data alone is difficult to interpret quickly.
Large spreadsheets, disconnected reports, and static exports often create more confusion rather than clarity. Teams waste time manually compiling reports instead of identifying trends and taking action.
That is where modern interactive dashboard tools become valuable.
Visualization platforms help businesses transform complex datasets into understandable visual formats such as:
- charts
- graphs
- heatmaps
- dashboards
- treemaps
- geo maps
- Sankey diagrams
- KPI trackers
Visual reporting dramatically improves how teams communicate information internally.
Executives can review performance quickly. Marketing teams can monitor attribution trends. Operations teams can identify bottlenecks faster. Analysts can present insights more clearly to non-technical stakeholders.
Real-time dashboards also reduce reporting delays because businesses no longer need to wait for manually updated spreadsheets.
The result is faster decision-making, clearer reporting, and more accessible analytics across organizations.
What Makes Great Data Visualization Software?
The best data presentation software is not simply the platform with the most chart types.
Strong visualization platforms help businesses explore, interpret, and communicate data clearly while remaining easy enough for teams to use consistently.
One of the most important capabilities is interactivity.
Modern dashboards should allow users to:
- apply filters
- drill down into datasets
- explore metrics dynamically
- switch visual views
- customize reporting perspectives
This creates far more useful reporting workflows than static charts.
Real-time data connectivity is another major factor. Businesses increasingly rely on live dashboards connected directly to:
- CRMs
- cloud databases
- marketing platforms
- APIs
- ecommerce systems
- analytics platforms
Visualization tools should update automatically rather than requiring manual exports constantly.
Collaboration features also matter heavily.
Teams often need to:
- share dashboards
- embed charts
- export reports to PDF
- annotate data
- present insights visually
- distribute dashboards externally
Usability is equally important.
Some enterprise BI tools are extremely powerful but require technical expertise and heavy onboarding. Other platforms focus on simplicity and accessibility for non-technical business teams.
The best chart building software balances flexibility, usability, scalability, and presentation quality effectively.
The 12 Best Data Visualization Software Platforms
1. Tableau
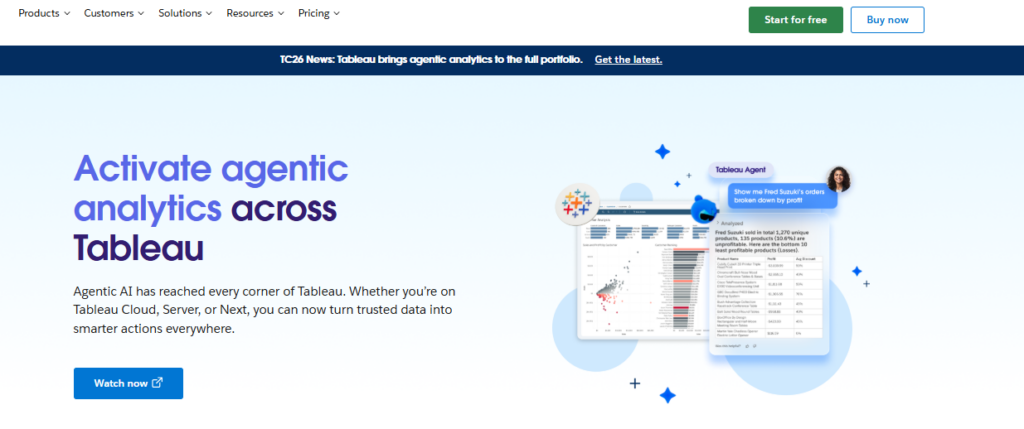
Advanced business intelligence and analytics.
Tableau remains one of the most widely recognized data visualization platforms because of its deep analytics capabilities and highly interactive dashboards.
The platform supports:
- advanced visualizations
- drill-down analytics
- real-time dashboards
- geospatial mapping
- interactive filters
- enterprise reporting
Tableau is especially strong for organizations handling large datasets and advanced business intelligence workflows.
Pros
- Extremely powerful visualizations
- Strong dashboard flexibility
- Advanced analytics
- Enterprise scalability
Cons
- Larger learning curve
- Premium pricing
Best Use Case
Businesses needing advanced enterprise analytics.
2. Microsoft Power BI
Businesses using Microsoft products.
Power BI has become one of the most popular business intelligence platforms because of its integration with the Microsoft ecosystem.
It connects seamlessly with:
- Excel
- Azure
- SQL Server
- Microsoft 365
- Dynamics
The platform provides strong reporting capabilities while remaining relatively affordable.
Pros
- Strong Microsoft integration
- Affordable pricing
- Excellent dashboards
- Enterprise-ready
Cons
- Best within Microsoft ecosystem
- Complex enterprise features
Best Use Case
Businesses already operating heavily within Microsoft infrastructure.
3. Looker Studio
Marketing and reporting dashboards.
Looker Studio, formerly Google Data Studio, is widely used for marketing analytics and lightweight reporting.
It integrates especially well with:
- Google Analytics
- Google Ads
- Search Console
- BigQuery
- YouTube analytics
Pros
- Free platform
- Easy sharing
- Strong Google integrations
- Beginner-friendly
Cons
- Less advanced analytics
- Limited enterprise complexity
Best Use Case
Marketing reporting and lightweight dashboards.
4. Qlik Sense
Associative analytics and data exploration.
Qlik Sense stands out because of its associative analytics engine, which allows users to explore relationships across datasets dynamically.
The platform supports highly interactive exploration workflows for enterprise analytics.
Pros
- Strong interactive analysis
- Dynamic exploration
- Enterprise functionality
- Advanced visualizations
Cons
- More technical onboarding
- Higher pricing
Best Use Case
Businesses prioritizing exploratory analytics.
5. Domo
Executive business dashboards.
Domo focuses heavily on real-time operational visibility and executive reporting.
The platform combines:
- live dashboards
- cloud integrations
- KPI monitoring
- collaborative reporting
- operational analytics
Pros
- Real-time visibility
- Executive-friendly dashboards
- Strong integrations
- Cloud-native workflows
Cons
- Enterprise pricing
- Less SMB-focused
Best Use Case
Executive reporting and operational visibility.
6. Sisense
Embedded analytics platforms.
Sisense specializes heavily in embedding dashboards and analytics directly into products and customer applications.
This makes it highly valuable for SaaS businesses offering analytics to customers.
Pros
- Strong embedded analytics
- Scalable architecture
- Flexible integrations
- Enterprise functionality
Cons
- Enterprise complexity
- Premium pricing
Best Use Case
Businesses embedding analytics into products.
7. Zoho Analytics
Affordable SMB reporting.
Zoho Analytics offers strong business reporting capabilities at relatively affordable pricing for smaller organizations.
The platform supports:
- dashboards
- reports
- chart building
- KPI tracking
- data blending
Pros
- Affordable pricing
- Good usability
- SMB-friendly
- Strong integrations
Cons
- Less advanced enterprise analytics
- Smaller ecosystem
Best Use Case
Small and mid-sized business reporting.
8. Grafana

Real-time operational and infrastructure analytics.
Grafana is widely used for technical monitoring and operational dashboards.
The platform excels at:
- real-time metrics
- infrastructure dashboards
- cloud monitoring
- operational analytics
- time-series visualization
Pros
- Excellent real-time dashboards
- Open-source flexibility
- Strong integrations
- Highly customizable
Cons
- More technical setup
- Less business-focused visuals
Best Use Case
Infrastructure and operational analytics.
9. Apache Superset
Open-source business intelligence.
Apache Superset provides flexible open-source dashboard creation and business intelligence capabilities.
It supports:
- chart building
- SQL-based analysis
- dashboard sharing
- interactive filtering
Pros
- Free and open-source
- Flexible customization
- Strong community ecosystem
- Scalable reporting
Cons
- Technical setup required
- Less beginner-friendly
Best Use Case
Technical teams wanting open-source BI flexibility.
10. Metabase
Simple internal analytics.
Metabase focuses heavily on simplicity and usability for non-technical business teams.
The platform makes it easy to create dashboards and ask analytical questions without deep technical expertise.
Pros
- Very user-friendly
- Fast dashboard setup
- Good internal reporting
- Affordable scaling
Cons
- Less advanced analytics depth
- Simpler visualizations
Best Use Case
Internal team reporting and lightweight analytics.
11. Infogram
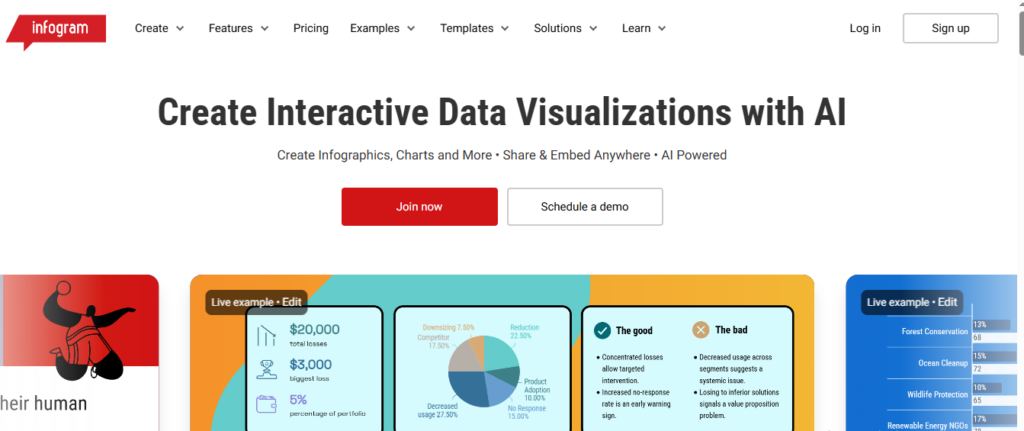
Presentation-focused visual reporting.
Infogram specializes heavily in presentation-quality visual content and infographic creation.
Businesses use it for:
- reports
- presentations
- visual storytelling
- marketing visuals
- executive summaries
Pros
- Excellent presentation visuals
- Easy usability
- Strong infographic capabilities
- Fast content creation
Cons
- Less enterprise analytics depth
- Limited advanced BI functionality
Best Use Case
Presentation and storytelling-focused reporting.
12. Flourish
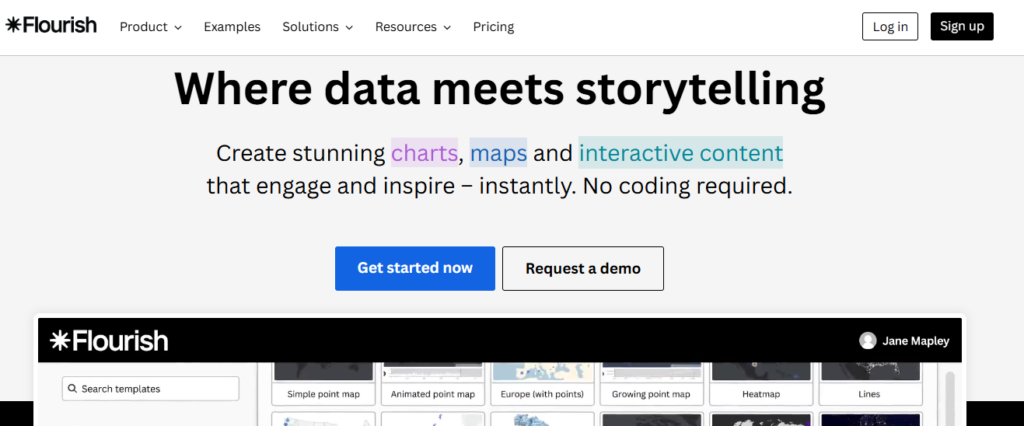
Interactive visual storytelling.
Flourish focuses heavily on advanced visual storytelling and interactive public-facing visualizations.
It supports:
- animated charts
- interactive maps
- storytelling dashboards
- presentation visuals
Pros
- Beautiful interactive visuals
- Strong storytelling tools
- Excellent animations
- Modern design workflows
Cons
- Less operational BI functionality
- More presentation-focused
Best Use Case
Interactive public-facing visual content.
Which Data Visualization Platform Should You Choose?
Source: Libretexts Business
The best data visualization software depends heavily on how your business uses data.
Tableau remains one of the strongest enterprise BI solutions for advanced analytics and large datasets, while Power BI offers excellent value for businesses operating inside the Microsoft ecosystem.
Marketing teams often prefer Looker Studio because of its simplicity and Google integrations, while technical teams commonly use Grafana for real-time operational dashboards.
Businesses prioritizing presentation quality may prefer Infogram or Flourish, while startups and SMBs often benefit from simpler tools like Metabase or Zoho Analytics.
The most important factor is choosing a platform that makes data easier to understand and act on rather than simply creating more dashboards.
Didn’t find what you were looking for? Try: 9 Best Business Intelligence Tools for SMBs in 2026
Frequently Asked Questions
What is the best data visualization software?
The best data visualization software depends heavily on your business goals, technical workflows, and reporting complexity. Tableau is widely considered one of the strongest platforms for advanced analytics and enterprise dashboards because of its deep interactivity and visualization flexibility.
Power BI is extremely popular among businesses using Microsoft products because of its affordability and strong ecosystem integrations. Looker Studio is commonly used for marketing dashboards and lightweight reporting, while Qlik Sense focuses heavily on dynamic exploratory analytics. Businesses prioritizing executive dashboards and operational visibility often choose platforms like Domo or Sisense.
What is data visualization software used for?
Data visualization software helps businesses transform large and often complex datasets into visual formats that are easier to understand and act on. Modern data visualization platforms are used to create dashboards, KPI trackers, charts, maps, reports, and interactive analytics environments that improve business reporting and decision-making.
Companies use these tools to monitor sales, analyze customer behavior, track marketing performance, visualize operational workflows, monitor financial metrics, and simplify business intelligence reporting across teams and departments.
What is the difference between BI software and data visualization tools?
Business intelligence software typically includes broader capabilities such as data modeling, warehousing, forecasting, advanced analytics, ETL processes, and operational reporting. Data visualization tools focus more specifically on presenting information visually through charts, dashboards, maps, and interactive reports.
However, many modern interactive dashboard tools now combine both business intelligence and visualization functionality within unified platforms. Solutions like Tableau and Power BI are considered both BI and visualization platforms because they support analytics workflows alongside visual reporting.
Can data visualization tools work with real-time data?
Yes. Most modern data visualization software platforms support real-time or near real-time data connections from APIs, cloud databases, CRMs, analytics tools, ecommerce platforms, and operational systems. This allows businesses to monitor live dashboards without manually exporting spreadsheets or updating reports constantly.
Real-time dashboards are especially useful for ecommerce operations, SaaS analytics, infrastructure monitoring, marketing performance tracking, and operational reporting where teams need continuously updated information.
What chart types are commonly used in visualization software?
Modern chart building software supports a wide range of visual formats depending on reporting goals and dataset complexity. Common chart types include:
- bar charts
- line charts
- area charts
- pie charts
- scatter plots
- treemaps
- geo maps
- Sankey diagrams
- heatmaps
- funnel visualizations
- KPI dashboards
- time-series graphs
Businesses often combine multiple visualization formats within interactive dashboards to present information more clearly and improve analysis workflows.
Is Tableau better than Power BI?
Both Tableau and Power BI are excellent data visualization platforms, but they serve slightly different audiences and business environments. Tableau is often preferred for advanced analytics, deep interactivity, highly customized dashboards, and complex enterprise reporting.
Power BI is widely adopted because of its affordability, accessibility, and strong integration with Microsoft products such as Excel, Azure, SQL Server, and Microsoft 365. Businesses already operating heavily inside the Microsoft ecosystem often find Power BI easier to integrate operationally.
What is an interactive dashboard?
An interactive dashboard is a visual reporting environment that allows users to explore data dynamically rather than viewing static charts or reports. Modern interactive dashboard tools allow users to apply filters, drill down into datasets, switch between visualizations, analyze trends, and customize reporting views in real time.
Interactive dashboards are commonly used for business intelligence, operational monitoring, marketing analytics, financial reporting, and executive decision-making because they make large datasets easier to explore and understand.
What is drill-down functionality in data visualization?
Drill-down functionality allows users to click into charts, reports, or visualizations to access more detailed layers of information. For example, a business might start with company-wide revenue data and then drill down into individual regions, products, campaigns, or customer segments.
Drill-down analytics are extremely important in modern data presentation software because they allow teams to move from high-level summaries into detailed operational insights quickly without creating separate reports manually.
Can data visualization software be embedded into websites or apps?
Yes. Many modern data visualization platforms allow businesses to embed dashboards, charts, and reports directly into websites, SaaS products, customer portals, and internal business systems.
Embedded analytics are especially valuable for SaaS companies offering reporting functionality to customers or businesses wanting centralized reporting inside operational platforms. Solutions like Sisense, Tableau, and Power BI offer strong embedded analytics capabilities for product integrations and client-facing dashboards.
Are free data visualization tools good enough for businesses?
Free visualization tools can work very well for smaller businesses, startups, and lightweight reporting workflows depending on complexity requirements. Platforms like Looker Studio, Grafana, Apache Superset, and Metabase provide strong reporting capabilities at little or no cost.
However, larger organizations handling advanced analytics, enterprise governance, large-scale data infrastructure, or highly customized dashboards often require more advanced paid platforms with enterprise security, scalability, support, and collaboration features.
What industries use data visualization software?
Almost every industry now uses data visualization software in some capacity because businesses increasingly rely on analytics and reporting to improve decision-making. Common industries using visualization platforms include:
- ecommerce
- SaaS
- healthcare
- finance
- logistics
- manufacturing
- marketing
- education
- cybersecurity
- retail
- operations
- cloud infrastructure
Visualization tools help teams identify trends, communicate insights, monitor KPIs, and simplify complex operational data across departments.
Can data visualization improve business decision-making?
Yes. One of the biggest advantages of using modern data visualization platforms is improved decision-making speed and clarity. Visual reporting makes trends, anomalies, bottlenecks, and performance patterns easier to identify compared to spreadsheets or static reports.
Executives, marketers, analysts, operations teams, and financial departments can all make faster and more informed decisions when information is presented visually through dashboards, interactive charts, and real-time reporting systems.
Software Chronicle’s Guide to Smarter Analytics & SaaS Tools
At Software Chronicle, we publish practical SaaS reviews, analytics software comparisons, automation guides, and business technology insights designed to help companies choose smarter digital tools.
To learn more about how we evaluate platforms, visit our How We Review Software page. You can also review our Affiliate Disclosure for transparency regarding affiliate partnerships and recommendations.
Have questions? Contact us now.
Najm Us Sahar Fareed is part of the editorial team at Software Chronicle, a group of SaaS researchers and former software buyers who have collectively evaluated over 200 tools across the categories we cover. With 5 years of experience working with digital marketing agencies across North America, she brings a strong background in content strategy and practical software evaluation.
Blog
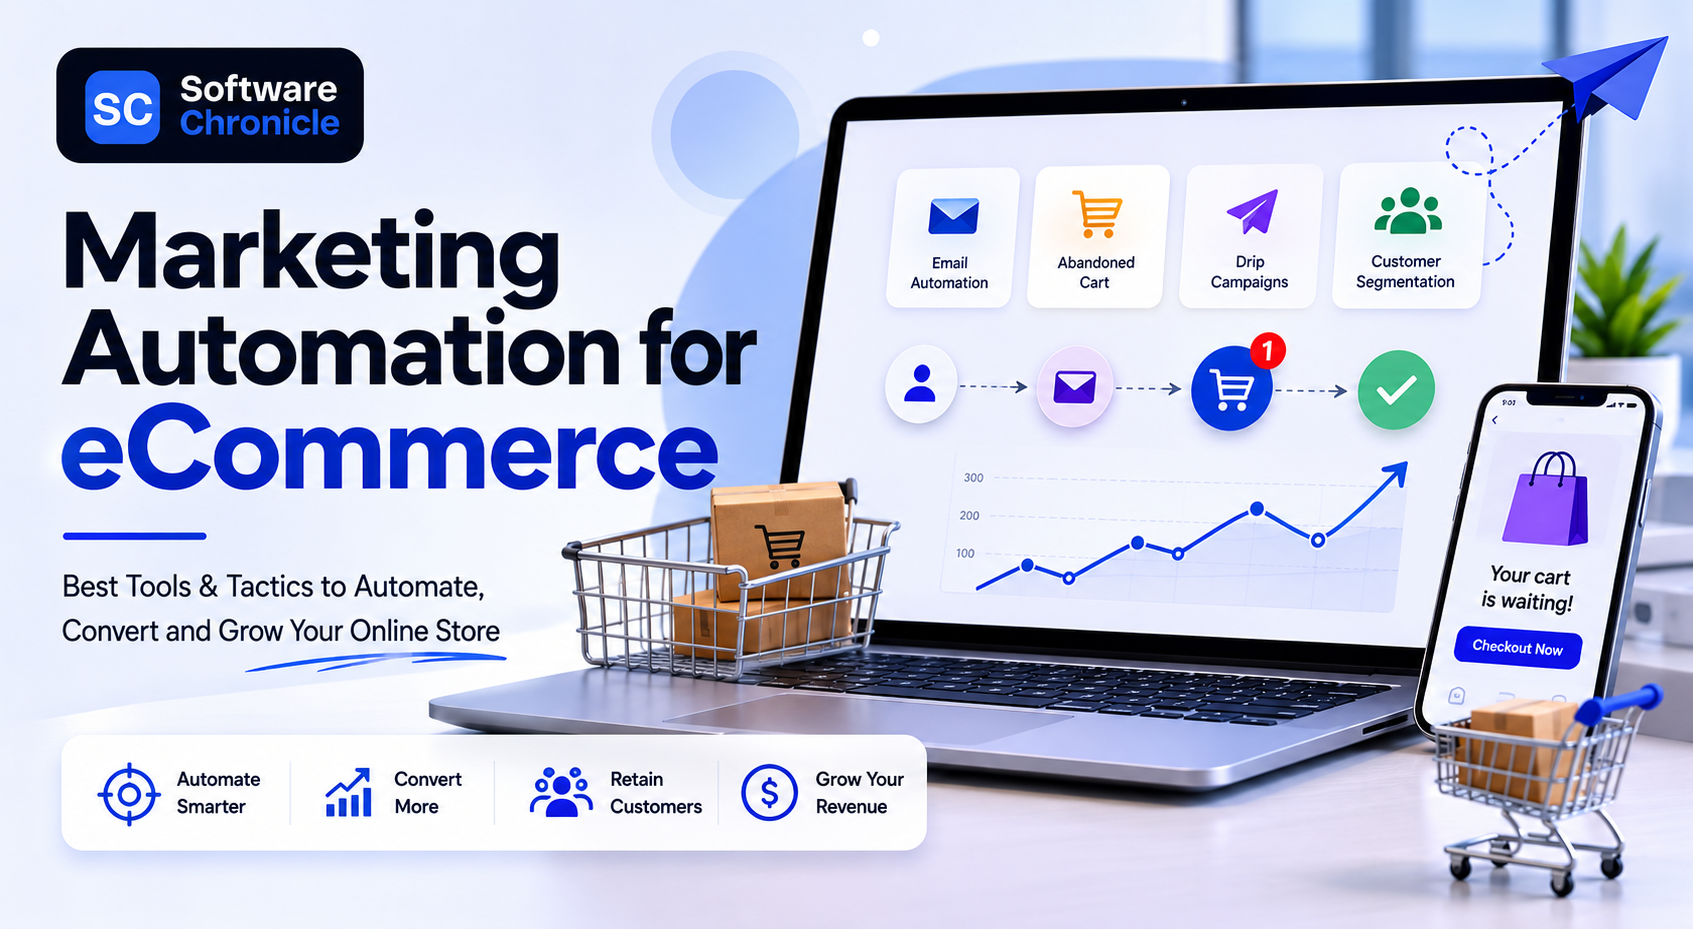
Marketing Automation for eCommerce: Tools & Tactics
Running an ecommerce business today is not just about getting traffic anymore. The real challenge starts after someone visits your store.
Customers browse products, abandon carts, open emails without buying, forget about brands, compare prices across multiple stores, and often need several touchpoints before making a purchase. Managing all of those interactions manually becomes almost impossible once an online store starts scaling.
That is why marketing automation for ecommerce has become one of the most important growth systems for modern online brands.
Instead of manually sending emails, tracking customer behavior, or following up with shoppers individually, ecommerce automation tools allow stores to build automated workflows that run continuously in the background. These systems can recover abandoned carts, send personalized product recommendations, trigger post-purchase sequences, win back inactive customers, and improve retention automatically.
Modern ecommerce marketing automation platforms now combine several functions, including customer segmentation, email automation, SMS marketing, behavioral triggers, product recommendations, loyalty workflows, analytics and reporting, and much more.
For ecommerce brands, this creates a major advantage because automation allows stores to scale customer communication without scaling manual workload at the same pace.
In this guide, we will break down how ecommerce marketing automation works, the best automation tools for online stores, the most important workflows every ecommerce business should build, and the automation tactics that actually drive revenue growth in 2026.
Quick Takeaways
- Marketing automation for ecommerce helps online stores automate customer communication, email campaigns, follow-ups, retention workflows, and personalized shopping experiences.
- Ecommerce automation platforms can automatically trigger abandoned cart emails, browse abandonment reminders, product recommendations, loyalty campaigns, and post-purchase sequences based on customer behavior.
- Shopify stores commonly use tools such as Klaviyo, Omnisend, Mailchimp, ActiveCampaign, and HubSpot for ecommerce email automation and customer retention workflows.
- Abandoned cart automation is one of the highest-converting ecommerce workflows because it targets customers who already showed strong buying intent.
- Ecommerce automation improves customer retention by sending personalized messages at the right time instead of relying only on manual campaigns.
- AI-driven automation platforms now use customer behavior, purchase history, and predictive analytics to personalize email timing, recommendations, and offers automatically.
- Post-purchase automation flows help ecommerce brands increase repeat purchases, customer satisfaction, referrals, and product reviews.
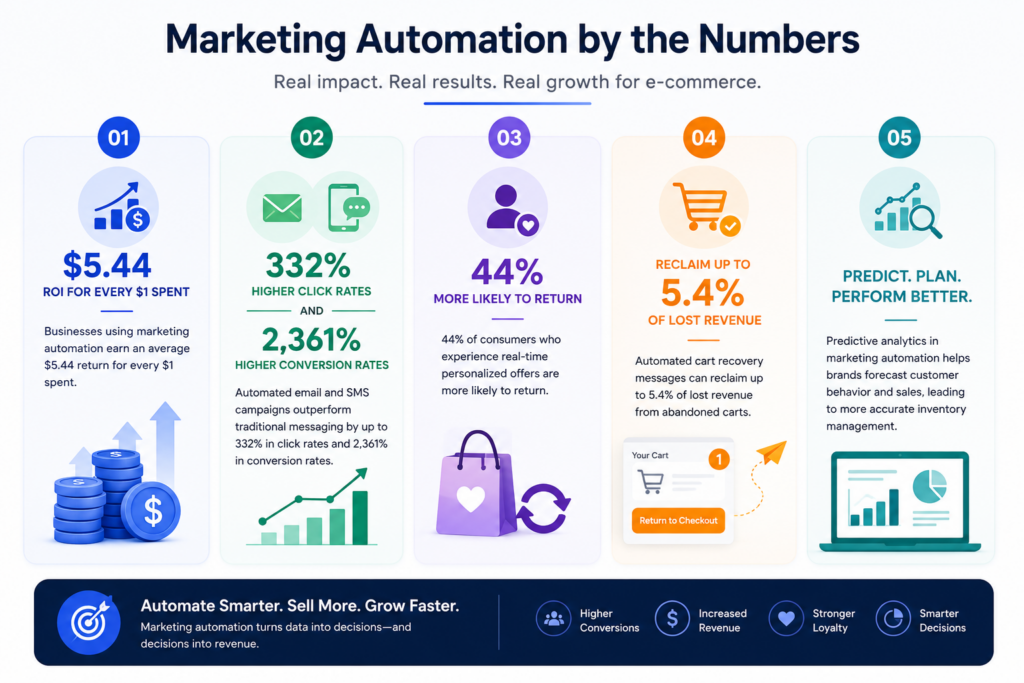
- According to Shopify and Klaviyo data, repeat customers often generate significantly higher long-term revenue compared to first-time buyers.
- Marketing automation is now used heavily across B2C, D2C, subscription ecommerce, beauty brands, fashion stores, supplement brands, and online retail businesses.
- Ecommerce businesses that automate customer communication usually scale faster because workflows continue running continuously in the background.
What Is Marketing Automation for eCommerce?
Marketing automation for ecommerce refers to using software and automated workflows to manage customer communication and marketing activities across an online store.
Instead of manually sending emails or tracking customer actions individually, automation platforms trigger messages automatically based on customer behavior.
For example:
- if someone abandons their cart, the system sends a reminder
- if a customer makes a purchase, the store sends a post-purchase sequence
- if someone views products repeatedly without buying, browse abandonment emails may trigger
- if a customer becomes inactive, a win-back campaign may launch automatically
The goal is to create more personalized communication at scale while reducing manual workload.
Modern ecommerce automation systems usually connect directly with platforms such as:
- Shopify
- WooCommerce
- BigCommerce
- Magento
- Amazon
- email marketing tools
- SMS platforms
- CRM systems
- loyalty programs
This allows businesses to centralize customer data and automate communication across multiple channels.
Why Ecommerce Automation Matters More Than Ever
Source: Zoko
Customer acquisition costs continue rising across Meta Ads, Google Ads, TikTok, and other advertising platforms.
That means ecommerce brands can no longer rely only on constantly acquiring new customers profitably.
Retention has become increasingly important.
Marketing automation helps ecommerce brands improve:
- repeat purchases
- customer retention
- average order value
- customer lifetime value
- engagement
- conversion rates
Instead of depending only on one-time purchases, automation helps businesses build long-term customer relationships.
This is one of the reasons automated email flows often outperform generic promotional campaigns. Customers respond better when communication feels timely and behavior-driven rather than random.
The Most Important Ecommerce Automation Workflows
Not all ecommerce automation flows generate the same impact.
Some workflows consistently outperform others across nearly every ecommerce niche.
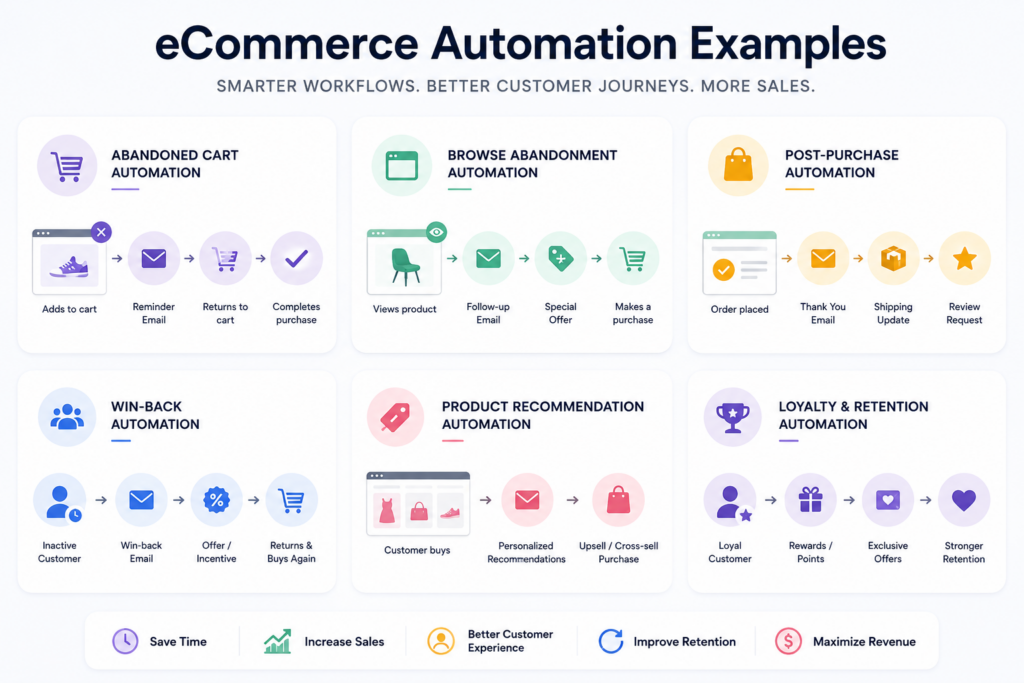
Abandoned Cart Automation
Cart abandonment automation is one of the highest-performing ecommerce workflows.
When shoppers add products to their cart but leave before completing checkout, automation platforms can send reminder emails or SMS messages encouraging them to return.
Most abandoned cart sequences include:
- reminder emails
- urgency messaging
- discount offers
- product images
- social proof
- recovery links
Because these customers already showed strong purchase intent, abandoned cart campaigns often generate extremely high ROI compared to standard email blasts.
Browse Abandonment Campaigns
Browse abandonment automation targets shoppers who viewed products but never added them to cart.
For example, if someone repeatedly visits product pages or collections, the automation platform may send:
- product reminders
- educational content
- reviews
- recommendations
- promotional offers
This workflow helps re-engage interested visitors before they completely forget about the brand.
Post-Purchase Automation
Post-purchase automation is one of the most underrated ecommerce growth systems.
Most stores focus heavily on acquiring customers but neglect communication after the sale.
Post-purchase flows commonly include:
- order confirmations
- shipping updates
- onboarding emails
- cross-sell recommendations
- review requests
- loyalty rewards
- referral incentives
Strong post-purchase automation improves customer experience while increasing repeat purchases significantly.
Win-Back Campaigns
Not every customer buys repeatedly without reminders.
Win-back automation targets inactive customers who have not purchased in a certain period of time.
These campaigns usually include:
- personalized offers
- product recommendations
- reminders
- new arrivals
- loyalty incentives
- seasonal promotions
Win-back sequences help ecommerce stores recover lost customers without constantly relying on paid acquisition.
Product Recommendation Automation
Modern automation tools now use customer behavior and purchase history to personalize recommendations automatically.
For example:
- customers who bought skincare products may receive complementary recommendations
- fashion stores may recommend matching items
- supplement brands may suggest refill reminders
Personalized recommendation flows help increase average order value while improving shopping experience.
The Best Marketing Automation Tools for eCommerce
Different automation platforms focus on different ecommerce workflows and business sizes.
Klaviyo
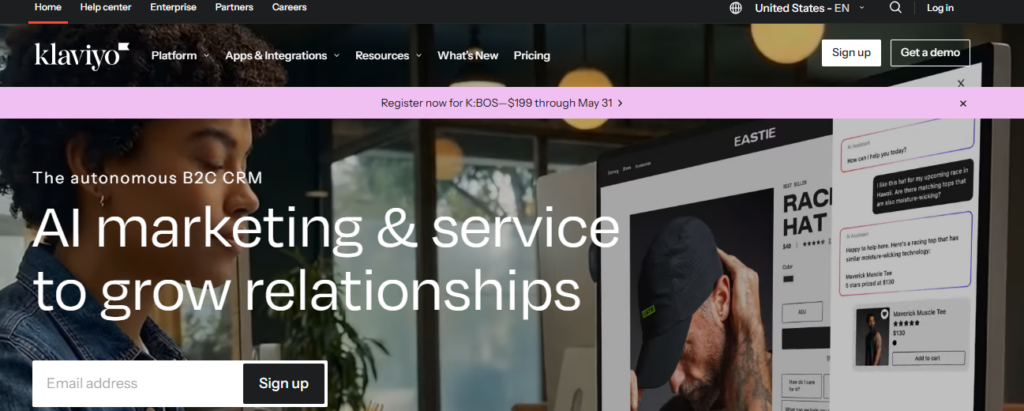
Klaviyo is one of the most popular ecommerce email automation platforms, especially for Shopify stores.
It focuses heavily on:
- advanced segmentation
- behavioral automation
- SMS marketing
- predictive analytics
- ecommerce personalization
Klaviyo is widely used by DTC brands because of its deep ecommerce integrations and powerful automation workflows.
Omnisend
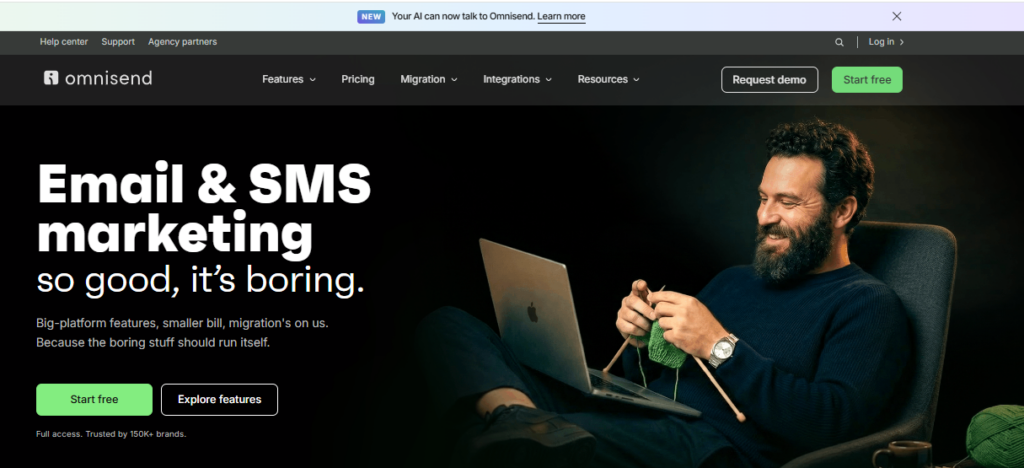
Omnisend is designed specifically for ecommerce marketing automation.
It combines:
- email automation
- SMS campaigns
- push notifications
- product recommendations
- cart recovery workflows
Many ecommerce businesses choose Omnisend because it is easier to use than some enterprise-focused platforms.
Mailchimp
Mailchimp remains one of the most widely recognized email marketing tools globally.
Although it started primarily as an email platform, it now includes ecommerce automation features such as:
- customer journeys
- abandoned cart emails
- product recommendations
- behavioral triggers
It is often used by smaller ecommerce stores and beginner-friendly businesses.
ActiveCampaign
ActiveCampaign combines email marketing automation with CRM functionality.
It is particularly strong for:
- customer segmentation
- automation workflows
- lifecycle marketing
- ecommerce personalization
- lead nurturing
Businesses wanting both CRM and ecommerce automation capabilities often choose ActiveCampaign.
HubSpot
HubSpot is commonly used by businesses wanting a broader marketing ecosystem alongside ecommerce automation.
It supports:
- CRM workflows
- email automation
- customer segmentation
- reporting
- lead nurturing
- omnichannel marketing
HubSpot is especially popular among B2B ecommerce and hybrid ecommerce-service businesses.
Need to explore more options? Read: 12 Best Marketing Automation Software for Small Business
How AI Is Changing Ecommerce Automation
AI is rapidly changing how ecommerce automation platforms operate.
Modern systems now analyze:
- customer behavior
- shopping patterns
- engagement timing
- product preferences
- purchase probability
- predicted lifetime value
This allows automation tools to personalize:
- email timing
- product recommendations
- subject lines
- offers
- audience segmentation
- loyalty campaigns
AI-driven personalization helps brands create more relevant customer experiences without manually managing every workflow.
Many ecommerce automation platforms now include predictive analytics and AI-generated recommendations directly inside campaign builders.
Ecommerce Automation Mistakes
One of the biggest mistakes ecommerce brands make is automating too much without personalization.
Customers still want communication to feel relevant and human.
Overusing aggressive sales emails or sending too many automated messages can increase unsubscribes quickly.
Another common problem is failing to segment customers properly. New visitors, repeat buyers, VIP customers, and inactive shoppers should not all receive identical messaging.
Poor timing also hurts automation performance. Sending messages too frequently or at irrelevant times can reduce engagement significantly.
Strong ecommerce automation works best when it feels timely, contextual, and behavior-driven rather than overly robotic.
Also, remember that automation is not only about automating your emails. These are two distinct terms with one being the subset of another.
What Are the 4 P’s of Ecommerce Marketing?
The traditional 4 P’s of marketing still apply heavily to ecommerce businesses:
- Product
- Price
- Place
- Promotion
Marketing automation mainly strengthens the promotion side by improving customer communication, retention campaigns, personalized offers, and lifecycle marketing.
However, automation also indirectly improves product discovery and customer experience throughout the shopping journey.
What Are the Main Ecommerce Business Models?
Ecommerce businesses usually operate under several major models:
- B2C (Business to Consumer)
- B2B (Business to Business)
- D2C (Direct to Consumer)
- C2C (Consumer to Consumer)
D2C ecommerce brands have grown particularly fast because automation tools allow brands to build direct customer relationships without relying entirely on marketplaces or retailers.
Why Ecommerce Automation Is Becoming Essential
As ecommerce competition continues increasing, customer retention and operational efficiency are becoming more important than ever.
Marketing automation helps online stores:
- recover lost sales
- improve retention
- personalize communication
- scale customer engagement
- increase repeat purchases
- reduce manual workload
Without automation, managing customer communication manually becomes increasingly difficult as stores grow.
That is why ecommerce automation is no longer just a “nice extra” for larger brands. It has become a core operational system for modern online businesses.
Frequently Asked Questions
What are some marketing automation tools?
Some of the most popular marketing automation tools for ecommerce include Klaviyo, Omnisend, Mailchimp, ActiveCampaign, HubSpot, Drip, and Brevo. Different platforms focus on different workflows, integrations, and business sizes. For example, Klaviyo is heavily used by Shopify brands for advanced segmentation and retention workflows, while HubSpot is more common among businesses needing CRM and broader marketing automation together.
What is ecommerce automation?
Ecommerce automation refers to using software and automated workflows to manage customer communication, email campaigns, retention sequences, abandoned cart recovery, product recommendations, and repetitive marketing tasks inside online stores. Instead of manually sending every message, automation tools trigger campaigns automatically based on customer behavior and shopping activity.
What is abandoned cart automation?
Abandoned cart automation sends reminder emails or SMS messages to shoppers who added products to their cart but left before completing checkout. These workflows often include product reminders, urgency messaging, discount incentives, and direct checkout links. Cart abandonment automation is considered one of the highest-converting ecommerce marketing workflows because it targets users who already showed strong purchase intent.
What is a post-purchase sequence?
A post-purchase sequence is an automated workflow triggered after a customer places an order. These flows usually include order confirmations, shipping updates, onboarding emails, review requests, upsells, loyalty messaging, and referral incentives. Strong post-purchase automation helps ecommerce brands improve customer experience and increase repeat purchases over time.
What are the 4 models of ecommerce?
The four main ecommerce models are B2C (Business to Consumer), B2B (Business to Business), C2C (Consumer to Consumer), and C2B (Consumer to Business). D2C (Direct to Consumer) is also commonly discussed today because many modern ecommerce brands now sell directly to customers without relying heavily on retailers or marketplaces.
Which ecommerce model is most profitable?
There is no universal answer because profitability depends heavily on niche, margins, operations, and customer acquisition costs. However, many brands focus heavily on D2C ecommerce because it allows stronger customer relationships, more control over branding, higher margins, and better retention opportunities compared to marketplace-only selling.
What is the difference between B2B and B2C ecommerce?
B2B ecommerce involves businesses selling products or services to other businesses, while B2C ecommerce involves businesses selling directly to consumers. B2B ecommerce usually has longer sales cycles, larger order values, and more relationship-driven purchasing decisions compared to B2C ecommerce.
What is browse abandonment automation?
Browse abandonment workflows target shoppers who viewed products or collections but did not add items to cart. These campaigns help re-engage interested visitors through product reminders, recommendations, educational content, and personalized offers before they completely leave the buying journey.
Can small ecommerce stores use automation?
Yes. Modern ecommerce automation tools are widely used by smaller Shopify stores, startups, and growing DTC brands because they improve efficiency and customer retention without requiring large teams. Many automation platforms now offer beginner-friendly workflows and templates specifically designed for smaller ecommerce businesses.
What is loyalty automation?
Loyalty automation helps ecommerce brands reward repeat customers automatically through points systems, referrals, VIP rewards, retention campaigns, birthday offers, and personalized incentives. Loyalty workflows are designed to improve customer retention and long-term lifetime value.
What is an ecommerce drip campaign?
An ecommerce drip campaign is a sequence of automated emails sent over time based on customer behavior or lifecycle stage. Drip campaigns are commonly used for welcome sequences, onboarding, educational content, product recommendations, and retention workflows. Instead of sending one-off campaigns manually, ecommerce drip automation nurtures customers gradually through timed messaging.
What is product recommendation automation?
Product recommendation automation uses customer behavior, purchase history, browsing activity, and AI-driven personalization to suggest relevant products automatically. Ecommerce stores often use these workflows inside emails, SMS campaigns, and post-purchase sequences to increase average order value and repeat purchases.
What is an order confirmation flow?
An order confirmation flow is an automated sequence triggered immediately after checkout. Besides confirming purchases, many brands use these emails to introduce onboarding content, shipping updates, loyalty programs, referral offers, and product education. These emails often generate very high open rates because customers actively expect them.
What is win-back automation in ecommerce?
Win-back automation targets inactive customers who have not purchased or engaged with a store for a certain period of time. These campaigns typically include reminders, special offers, personalized recommendations, or new product announcements designed to reactivate previous buyers.
How does ecommerce email automation work?
Ecommerce email automation works by using customer behavior triggers and workflows to send personalized emails automatically. Actions such as adding products to cart, browsing categories, completing purchases, or becoming inactive can all trigger different automated email sequences without manual input from the business.
Is SMS automation important for ecommerce?
Yes. SMS automation has become increasingly important because text messages often achieve significantly higher open rates than email. Many ecommerce brands now combine email automation and SMS automation together for cart recovery, shipping notifications, flash sales, loyalty messaging, and post-purchase communication.
What is customer segmentation in ecommerce marketing automation?
Customer segmentation involves grouping shoppers based on factors such as purchase history, behavior, engagement level, demographics, average order value, or lifecycle stage. Segmentation allows ecommerce brands to send more personalized communication instead of sending identical campaigns to every customer.
What are the biggest benefits of ecommerce automation?
The biggest benefits usually include improved customer retention, increased repeat purchases, higher average order value, better personalization, reduced manual workload, stronger customer experience, and improved marketing efficiency. Automation also allows ecommerce brands to scale communication much more effectively as customer volume grows.
Can ecommerce automation increase sales?
Yes. Strong automation workflows often increase ecommerce revenue significantly because they recover lost sales opportunities, improve retention, encourage repeat purchases, and personalize communication based on customer behavior. Many ecommerce brands generate a large percentage of their total revenue directly from automated flows rather than one-time promotional campaigns alone.
Software Chronicle’s Guide to Smarter eCommerce Growth Tools
At Software Chronicle, we publish practical ecommerce software guides, automation strategy content, SaaS reviews, and business technology comparisons designed to help brands grow more efficiently.
Our goal is to simplify complex software decisions with practical, experience-driven content focused on real business workflows and long-term scalability.
To learn more about how we evaluate software platforms, visit our How We Review Software page. You can also review our Disclaimer for additional transparency regarding our content and recommendations.
Want to get a tool reviewed? Contact us now.
Najm Us Sahar Fareed is part of the editorial team at Software Chronicle, a group of SaaS researchers and former software buyers who have collectively evaluated over 200 tools across the categories we cover. With 5 years of experience working with digital marketing agencies across North America, she brings a strong background in content strategy and practical software evaluation.
Blog
11 Best Application Monitoring Software Platforms in 2026
Software performance has become one of the biggest factors affecting customer experience, operational stability, and business growth. A slow-loading ecommerce site, unstable SaaS platform, delayed API response, or failing cloud application can immediately impact revenue, customer trust, and productivity.
Modern businesses are now expected to deliver fast, reliable digital experiences at all times, which is becoming increasingly difficult as applications grow more complex.
Today’s software environments often involve cloud infrastructure, distributed systems, databases, containers, third-party APIs, frontend frameworks, and mobile applications all working together simultaneously. When something breaks, identifying the actual source of the issue can become extremely challenging without proper visibility into how systems are performing behind the scenes.
That is why application performance monitoring has become essential for modern businesses. The best application monitoring software helps teams monitor uptime, track response times, analyze throughput, detect error spikes, monitor infrastructure health, aggregate logs, and identify performance bottlenecks before users are seriously affected. Modern APM tools now provide far more than basic uptime tracking.
Many platforms include distributed tracing, real user monitoring, synthetic monitoring, advanced alerting, infrastructure monitoring, and observability features designed for modern cloud-native applications.
Some monitoring platforms focus heavily on developer troubleshooting and deep technical diagnostics, while others prioritize operational simplicity and business-friendly dashboards. Choosing the right platform depends heavily on your infrastructure, workflows, technical complexity, and scalability requirements.
In this guide, we will break down the best application monitoring software platforms in 2026, including APM tools for SaaS companies, server monitoring tools, observability platforms, and infrastructure monitoring solutions for growing businesses and enterprise environments alike.
Quick Comparison Table
| Platform | Best For | Free Plan | Starting Price | Standout Feature |
| Datadog | Full-stack observability | Limited | Premium | Unified monitoring ecosystem |
| New Relic | Deep application visibility | Yes | Usage-based | Advanced APM analytics |
| Dynatrace | Enterprise AI monitoring | No | Enterprise pricing | AI-driven observability |
| Grafana Cloud | Flexible dashboards | Yes | Flexible pricing | Open-source ecosystem |
| AppDynamics | Enterprise monitoring | No | Enterprise pricing | Business transaction tracking |
| Sentry | Error tracking | Yes | Developer-friendly | Real-time debugging |
| Elastic Observability | Log-heavy environments | Yes | Flexible pricing | Powerful log aggregation |
| Splunk Observability | Enterprise analytics | No | Premium pricing | Large-scale observability |
| Pingdom | Website uptime monitoring | Yes | Affordable | Synthetic monitoring |
| Prometheus | Infrastructure metrics | Free | Open-source | Kubernetes monitoring |
| Honeycomb | Distributed tracing | Limited | Modern pricing | High-cardinality observability |
Why Monitoring Software Has Become Essential
Source: Fortune Business Insights
A few years ago, monitoring usually meant checking whether a server was online.
That approach no longer works for modern applications.
Today’s systems are dynamic and highly interconnected. A single slowdown might involve:
- frontend rendering
- cloud infrastructure
- APIs
- database queries
- container orchestration
- authentication services
- caching systems
- third-party integrations
Without proper monitoring visibility, troubleshooting becomes reactive and time-consuming.
That creates several problems for businesses.
First, outages become harder to diagnose. Teams waste time manually searching through logs, guessing root causes, or responding only after customers report issues publicly.
Second, performance issues often go unnoticed until revenue or user experience is already affected.
For SaaS businesses, this can directly affect customer retention. For ecommerce stores, even small increases in response time can reduce conversions and increase abandoned carts.
Modern application performance monitoring tools help businesses move from reactive troubleshooting to proactive infrastructure management.
Instead of waiting for systems to fail, teams can monitor:
- response time
- throughput
- uptime
- infrastructure usage
- application latency
- crash frequency
- error rates
- user experience metrics
This visibility allows businesses to identify bottlenecks and operational risks before they become major incidents.
Monitoring platforms also improve collaboration between:
- engineering teams
- DevOps
- support departments
- infrastructure teams
- product operations
Everyone gains access to centralized visibility rather than relying on fragmented troubleshooting.
What Businesses Should Look for in Application Monitoring Software
Choosing the best monitoring platform is not only about collecting data.
The real value comes from turning technical information into actionable insights.
One of the most important capabilities today is distributed tracing.
Modern applications rarely operate inside a single server environment. Requests often move across APIs, services, databases, and cloud systems simultaneously. Distributed tracing helps businesses visualize how requests move through applications and where bottlenecks occur.
This dramatically improves troubleshooting speed.
Real user monitoring is another critical feature because it measures actual customer experience rather than only internal server metrics.
Businesses can analyze:
- page load speed
- frontend rendering
- interaction delays
- session performance
- geographic performance differences
Synthetic monitoring complements this by simulating user activity proactively. Businesses can test workflows continuously and detect failures before customers encounter them.
Strong alerting systems are equally important.
Monitoring platforms should notify teams immediately when:
- downtime occurs
- error rates spike
- response times increase
- infrastructure resources become overloaded
- services fail unexpectedly
Log aggregation also plays a major role in troubleshooting modern distributed systems. Centralized logging allows businesses to search across infrastructure and applications quickly instead of manually inspecting multiple environments separately.
Infrastructure monitoring remains extremely important as well because many application problems originate from:
- servers
- cloud resources
- containers
- memory usage
- databases
- network congestion
The best platforms combine all these capabilities into a single observability workflow.
The 11 Best Application Monitoring Software Platforms
1. Datadog
Best For
Full-stack observability across cloud infrastructure.
Datadog has become one of the most popular observability platforms because it combines application monitoring, infrastructure visibility, cloud monitoring, logging, dashboards, and security tooling into a unified ecosystem.
The platform integrates with hundreds of services and works especially well for cloud-native businesses operating distributed environments.
Datadog supports:
- APM monitoring
- infrastructure monitoring
- container monitoring
- synthetic testing
- real user monitoring
- trace analysis
- log aggregation
Its dashboards are highly visual and customizable, making it easier for teams to centralize operational visibility.
Pros
- Massive integration ecosystem
- Unified observability
- Excellent dashboards
- Strong cloud-native support
Cons
- Pricing scales quickly
- Can become expensive for large environments
Best Use Case
Growing SaaS businesses and cloud infrastructure teams.
2. New Relic
Best For
Deep application performance visibility.
New Relic remains one of the strongest platforms for detailed application performance monitoring and diagnostics.
The platform excels at:
- distributed tracing
- response time analysis
- transaction monitoring
- infrastructure visibility
- real user monitoring
- application analytics
Developers and DevOps teams particularly value its deep troubleshooting capabilities.
Pros
- Excellent APM visibility
- Strong diagnostics
- Detailed performance insights
- Good free tier
Cons
- Can feel complex initially
- Usage pricing requires monitoring
Best Use Case
Engineering teams needing deep application diagnostics.
3. Dynatrace
Best For
Enterprise AI-driven observability.
Dynatrace focuses heavily on enterprise infrastructure and AI-powered monitoring automation.
Its AI engine automatically detects anomalies, maps dependencies, and identifies root causes across highly distributed environments.
This reduces manual troubleshooting and operational noise for larger organizations.
Pros
- AI-powered monitoring
- Enterprise scalability
- Automated dependency mapping
- Strong infrastructure visibility
Cons
- Enterprise pricing
- Larger learning curve
Best Use Case
Large enterprises managing highly complex systems.
4. Grafana Cloud
Best For
Custom dashboards and open-source observability.
Grafana has become extremely popular because of its flexible dashboard ecosystem and strong open-source integrations.
Businesses can combine:
- logs
- traces
- metrics
- infrastructure monitoring
- synthetic monitoring
into highly customizable observability environments.
Pros
- Excellent visualizations
- Open-source flexibility
- Strong community ecosystem
- Cost-efficient scaling
Cons
- Requires technical configuration
- Less beginner-friendly
Best Use Case
Technical teams wanting flexible monitoring control.
5. AppDynamics
Best For
Business transaction monitoring.
AppDynamics focuses heavily on connecting technical performance directly to business outcomes.
The platform helps businesses monitor transactions across applications while analyzing customer impact and operational performance.
Pros
- Strong enterprise functionality
- Business-centric monitoring
- Good transaction visibility
- Advanced analytics
Cons
- Enterprise complexity
- Premium pricing
Best Use Case
Businesses monitoring critical customer-facing workflows.
6. Sentry
Best For
Error tracking and debugging.
Sentry specializes heavily in real-time crash reporting and application debugging.
Developers use it to identify:
- frontend crashes
- backend exceptions
- deployment issues
- stack traces
- performance errors
Its developer-focused workflows make debugging significantly faster.
Pros
- Excellent error visibility
- Developer-friendly
- Fast implementation
- Strong debugging workflows
Cons
- Less infrastructure monitoring
- Narrower scope than full observability platforms
Best Use Case
Development teams prioritizing application debugging.
7. Elastic Observability
Best For
Log-heavy observability environments.
Elastic combines metrics, traces, search, and centralized logging into a scalable observability ecosystem.
The platform works especially well for businesses handling large operational data volumes.
Pros
- Powerful log aggregation
- Flexible querying
- Scalable infrastructure
- Strong search functionality
Cons
- Technical setup complexity
- Requires tuning for optimization
Best Use Case
Businesses prioritizing centralized logging and operational search.
8. Splunk Observability
Best For
Large-scale enterprise observability.
Splunk focuses heavily on operational intelligence, enterprise infrastructure monitoring, and large-scale observability analytics.
It is commonly used in enterprise environments handling massive infrastructure complexity.
Pros
- Enterprise-grade analytics
- Advanced monitoring
- Large-scale visibility
- Strong operational insights
Cons
- Expensive
- Complex onboarding
Best Use Case
Large enterprises with advanced monitoring requirements.
9. Pingdom
Best For
Website uptime and synthetic monitoring.
Pingdom is one of the simplest monitoring platforms for businesses prioritizing uptime visibility and website performance tracking.
It works particularly well for ecommerce stores and customer-facing websites.
Pros
- Easy setup
- Reliable uptime alerts
- Beginner-friendly
- Strong synthetic testing
Cons
- Less technical depth
- Limited observability scope
Best Use Case
Businesses monitoring website availability and performance.
10. Prometheus
Best For
Infrastructure metrics and Kubernetes monitoring.
Prometheus remains one of the most widely adopted open-source monitoring systems for cloud-native infrastructure.
It is especially popular inside Kubernetes environments and modern DevOps workflows.
Pros
- Free and open-source
- Excellent metrics collection
- Strong Kubernetes ecosystem
- Developer-friendly
Cons
- Technical setup required
- Less approachable for beginners
Best Use Case
Engineering teams managing cloud-native infrastructure.
11. Honeycomb
Best For
Modern distributed tracing workflows.
Honeycomb focuses heavily on observability for highly distributed systems and modern debugging workflows.
Its high-cardinality observability model allows teams to analyze complex production environments more effectively.
Pros
- Excellent distributed tracing
- Modern observability workflows
- Strong debugging capabilities
- Developer-focused visibility
Cons
- Technical learning curve
- Smaller ecosystem
Best Use Case
Modern engineering teams managing distributed applications.
Monitoring vs Observability: What Is the Difference?
Many businesses use the terms monitoring and observability interchangeably, but they are not exactly the same.
Traditional monitoring focuses primarily on tracking known metrics and generating alerts when thresholds are exceeded.
For example:
- server CPU usage
- uptime monitoring
- response time spikes
- memory usage alerts
Observability goes deeper.
Modern observability platforms help teams understand why issues occur by combining:
- logs
- traces
- metrics
- infrastructure visibility
- application analysis
Observability is especially important for modern distributed systems because problems are often unpredictable and interconnected.
The best application monitoring software platforms increasingly combine both monitoring and observability capabilities into unified environments.
Which Application Monitoring Software Should You Choose?
The best platform depends heavily on your technical workflows, infrastructure complexity, and operational priorities.
Datadog remains one of the strongest all-around platforms for cloud-native businesses needing centralized observability across infrastructure, logs, and applications.
New Relic excels at deep application diagnostics and performance visibility, while Dynatrace focuses heavily on enterprise AI-driven observability.
Businesses prioritizing uptime simplicity may prefer Pingdom, while engineering-heavy organizations often rely heavily on Grafana, Prometheus, or Honeycomb.
Developer-focused teams commonly use Sentry for error tracking and debugging workflows.
The most important factor is not simply collecting more technical data. It is choosing a monitoring platform that helps teams resolve issues faster, improve uptime, and maintain strong customer experiences consistently.
Frequently Asked Questions
What is application performance monitoring?
Application performance monitoring, commonly known as APM, refers to software tools that help businesses monitor the health, speed, stability, and reliability of applications across servers, cloud environments, databases, APIs, and frontend systems. Modern application performance monitoring platforms track metrics such as response time, throughput, uptime, error rates, and infrastructure usage to help teams identify issues before customers are seriously affected.
APM tools are widely used by SaaS companies, ecommerce businesses, cloud-native applications, and enterprise software teams to improve system reliability and user experience.
What is the best application monitoring software?
The best application monitoring software depends heavily on the size of your infrastructure, technical workflows, and monitoring priorities. Datadog is one of the strongest all-around observability platforms for cloud-native businesses because it combines APM monitoring, infrastructure visibility, logging, and dashboards in a single ecosystem.
New Relic is highly popular for deep application diagnostics and performance analysis, while Dynatrace focuses heavily on enterprise AI-driven observability. Businesses prioritizing open-source flexibility often prefer Grafana Cloud or Prometheus, while developer-focused teams commonly rely on Sentry for error tracking and debugging.
What is the difference between monitoring and observability?
Monitoring and observability are closely related but not identical. Traditional monitoring focuses mainly on tracking known metrics such as uptime, server usage, response times, and predefined alerts.
Observability goes much deeper by helping businesses understand why issues happen rather than simply notifying teams that something failed. Modern observability platforms combine logs, metrics, traces, infrastructure visibility, and distributed system analysis to help engineering teams troubleshoot highly complex cloud-native environments more effectively. Many modern APM tools now combine both monitoring and observability features into unified platforms.
Do small businesses need monitoring software?
Yes. Even small businesses can benefit significantly from using application monitoring software because downtime, slow-loading applications, server failures, and API issues can directly affect customer experience and revenue. Ecommerce stores, SaaS startups, booking platforms, and service-based businesses all rely heavily on application performance today.
Monitoring tools help smaller businesses proactively detect outages, monitor uptime, improve load speed, and maintain operational stability before technical problems become larger business issues.
What is synthetic monitoring?
Synthetic monitoring is a proactive testing method where monitoring software simulates user interactions with websites, applications, APIs, or workflows to detect outages and performance issues before real users encounter them.
Businesses use synthetic monitoring to continuously test important customer journeys such as logins, checkout processes, booking systems, and API requests. This helps teams identify problems early rather than waiting for customers to report broken functionality. Many modern application performance monitoring platforms include synthetic monitoring alongside infrastructure monitoring and real user monitoring capabilities.
What is real user monitoring?
Real user monitoring, often called RUM, analyzes actual customer experiences by tracking metrics such as page load speed, frontend responsiveness, session behavior, interaction delays, device performance, and geographic latency across real user sessions.
Unlike synthetic monitoring, which simulates behavior artificially, real user monitoring measures how actual visitors experience an application in production environments. Businesses use real user monitoring to improve customer experience, optimize frontend performance, and identify regional or device-specific issues affecting users.
What metrics do application monitoring tools track?
Modern application monitoring software tracks a wide range of technical and operational metrics depending on the platform. Common monitoring metrics include response time, throughput, uptime, CPU usage, memory consumption, error rates, database performance, API latency, network traffic, and infrastructure health.
More advanced observability platforms also support distributed tracing, log aggregation, frontend monitoring, cloud resource visibility, and user experience analytics. These metrics help businesses identify bottlenecks, diagnose failures, and maintain stable application performance.
What is distributed tracing in application monitoring?
Distributed tracing is a monitoring technique that tracks how requests move across multiple services, APIs, databases, and cloud systems within modern distributed applications.
Since many applications now rely on microservices and interconnected infrastructure, performance issues often involve multiple components simultaneously. Distributed tracing allows teams to visualize request paths, identify latency bottlenecks, and troubleshoot failures more efficiently. Advanced APM tools such as Datadog, New Relic, Dynatrace, and Honeycomb provide strong distributed tracing capabilities for cloud-native applications.
Can application monitoring software improve customer experience?
Yes. One of the biggest benefits of using application performance monitoring software is improving customer experience by reducing downtime, improving application speed, and identifying technical issues before they affect users. Slow-loading websites, unstable mobile apps, failed API requests, and server outages can quickly reduce customer trust and conversions.
Monitoring tools help businesses maintain faster response times, stronger uptime, and more reliable digital experiences across applications and devices.
Is infrastructure monitoring different from application monitoring?
Yes. Infrastructure monitoring focuses mainly on servers, cloud resources, containers, databases, storage systems, and network performance, while application monitoring focuses more directly on application behavior, response times, frontend performance, and customer experience. However, modern observability platforms increasingly combine both capabilities because infrastructure issues often directly affect application performance.
Many businesses now prefer unified monitoring platforms that provide both infrastructure visibility and application performance monitoring within a single dashboard.
Are open-source monitoring tools good enough for businesses?
Open-source monitoring platforms such as Prometheus and Grafana can be extremely powerful for businesses with technical teams capable of configuring and managing observability environments. These platforms provide strong flexibility, scalability, and customization for cloud-native monitoring workflows.
However, managed monitoring platforms such as Datadog or New Relic may be easier for businesses wanting faster deployment, simplified management, centralized support, and integrated observability capabilities without heavy manual configuration.
How much does application monitoring software cost?
Pricing varies significantly depending on the monitoring platform, infrastructure size, data volume, and features required. Some platforms offer free plans for startups and smaller projects, while enterprise observability systems may cost thousands of dollars per month depending on usage.
Many modern best monitoring platforms use usage-based pricing models tied to infrastructure scale, hosts, logs, traces, or monitored applications. Businesses should evaluate long-term scalability costs carefully before selecting a monitoring solution.
Software Chronicle’s Guide to Smarter Infrastructure & SaaS Tools
At Software Chronicle, we publish practical SaaS reviews, infrastructure software comparisons, cybersecurity guides, and workflow optimization resources designed to help businesses make smarter technology decisions.
To learn more about how we evaluate software platforms, visit our How We Review Software page. You can also review our Affiliate Disclosure for transparency regarding affiliate partnerships and recommendations.
Have questions or recommendations? Contact us now.
Najm Us Sahar Fareed is part of the editorial team at Software Chronicle, a group of SaaS researchers and former software buyers who have collectively evaluated over 200 tools across the categories we cover. With 5 years of experience working with digital marketing agencies across North America, she brings a strong background in content strategy and practical software evaluation.
- 12 Best Data Visualization Software Platforms in 2026
- How Does CRM Software Work? Step-by-Step Explained
- Marketing Automation for eCommerce: Tools & Tactics
- 11 Best Application Monitoring Software Platforms in 2026
- 11 Best No-Code App Builders for Business in 2026

- 10 Best VPNs for Remote Teams in 2026

- 11 Best AI Chatbot Builders for Business in 2026

- 12 Best Live Chat Software for Websites in 2026

-

 Blog1 month ago
What Is Accounting Software? The Complete SMB Guide to Managing Finances
-
 Blog2 weeks ago
11 Agile Project Management Tools — Full Guide for Modern Teams (2026)
-
 Blog2 weeks ago
11 Best No-Code App Builders for Business in 2026
-
 Blog2 weeks ago
9 Best Business Intelligence Tools for SMBs in 2026
-
 Blog3 weeks ago
7 Best HR Software Platforms for Small Businesses in 2026
-
 Blog2 weeks ago
8 Best CI/CD Tools for Software Teams in 2026
-

 Blog1 month ago
What Is Marketing Automation? The Guide to Workflows and Growth (2026)
-
 Blog2 weeks ago
9 Best No-Code Website Builders in 2026